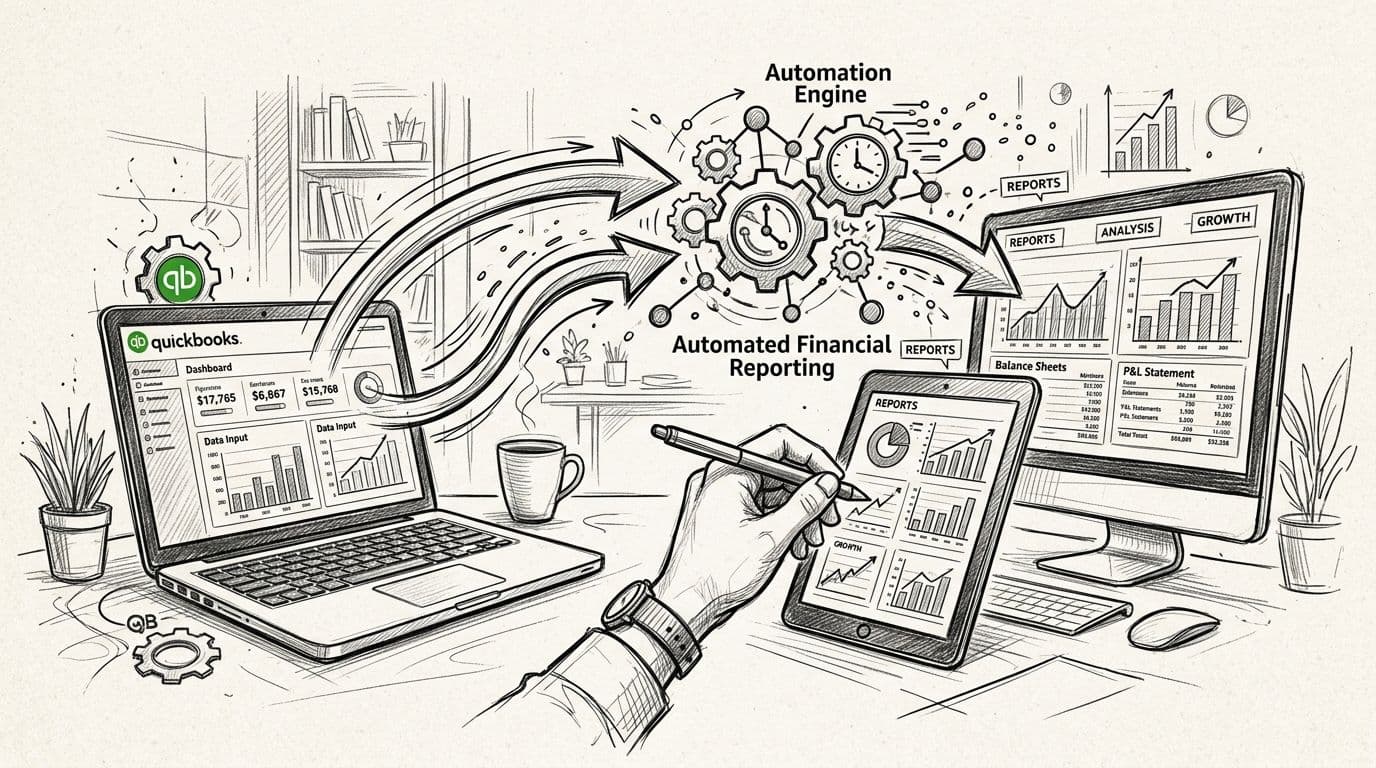
Rebuilding the same profit-and-loss statement every month in QuickBooks is slow, error-prone work: export a spreadsheet, adjust for accruals, paste it into a deck, and email it around. Instead of manually pulling QuickBooks data every close, connect your ledger to an automated reporting pipeline so financial statements and KPI dashboards refresh on a schedule, in the format your board, bank, and investors already expect.
TL;DR
- Automated QuickBooks reporting removes manual exports, version drift, and month-end spreadsheet work.
- Four build paths: native scheduled reports, middleware tools, the QuickBooks API, or a custom pipeline.
- Middleware routes take days to set up; custom pipelines need proper scoping.
- Clean your chart of accounts first — automation copies bad structure at full speed.
- Prizmstack builds reporting pipelines end to end and stays invested after launch.
Why this matters
Financial reporting is the highest-repetition work in most finance functions, and it is also the work where a single wrong cell costs credibility with a lender or investor. A 2026 finance team that still assembles reports by hand spends its senior attention on copy-paste instead of analysis. Automation does not replace judgment; it removes the copying so judgment starts earlier. Prizmstack treats automated reporting as a data infrastructure project, not a report export — which is why the pipeline survives the second year, not just the first demo.
Before you start
- Admin access to QuickBooks. Confirm whether you run QuickBooks Online or QuickBooks Desktop. Online exposes the modern API; Desktop integrations are a different, older toolkit. Everything below assumes QuickBooks Online.
- A written reporting spec. List the statements, KPIs, and audiences: monthly P&L and balance sheet for the board, weekly cash view for the CEO, AR aging for collections. Automation without a spec just speeds up the wrong report.
- A cleaned chart of accounts. This is the gotcha that bites mid-project: automation copies your account structure at full speed, including duplicates, dead accounts, and inconsistent naming. Consolidate obvious duplicates before you connect anything.
- Decide your build path. Native scheduled reports cover simple recurring statements. Middleware tools (Zapier, Make) connect QuickBooks to spreadsheets and dashboards with no code. The QuickBooks Online API and a custom pipeline give you full control — that is the path an embedded engineering partner like Prizmstack takes when the reporting logic is genuinely yours.
Step 1: Set up your QuickBooks data connection
- Pick the integration route that matches your spec. If every report is a standard QuickBooks statement, schedule it natively and stop there. If reports combine QuickBooks data with payroll, CRM, or ad spend, you need middleware or a custom pipeline.
- Authorize the connection with an admin account, not a junior user, so the integration can see every account it needs on day one. In the connection screen, review the permissions the app requests before you approve them.
- Scope the sync deliberately. Choose which accounts, classes, and locations flow into the reporting layer. Syncing everything feels safer and creates noise; sync what your spec names.
- Run a test sync and reconcile it. Pull one closed month and match the pipeline's totals against the QuickBooks P&L and balance sheet to the dollar. If the test does not tie, fix it now — a pipeline that is 98% right is still wrong for finance.
Expected result: data flows from QuickBooks into your reporting layer on demand, and a test month reconciles exactly.
Step 2: Model the reporting layer
- Map your chart of accounts to reporting lines. Every QuickBooks account should land on exactly one line of your P&L. Document the mapping in one place so the next auditor or the next engineer does not reverse-engineer it.
- Define the KPIs your audience acts on. Gross margin, operating expense ratio, monthly burn, runway, and AR aging cover most owner and board conversations. Each KPI needs a written formula — two teams computing burn differently is a reporting failure waiting to happen.
- Encode your accounting basis. Decide where accrual adjustments happen: inside QuickBooks, or in the pipeline. Pick one and document it, because double-adjusting is the most common way automated reports quietly diverge from the books.
- Keep the logic in version control. Whether the layer is a SQL model or a spreadsheet with named ranges, changes should be reviewable. Prizmstack puts reporting logic under the same code review discipline as product software, so a change to burn-rate math is a reviewed change, not a mystery.
Expected result: a documented mapping and KPI layer that turns raw QuickBooks data into your actual reporting vocabulary.
Step 3: Automate the distribution
- Anchor the refresh to your close calendar. A common 2026 pattern: books close on business day 5, statements refresh on business day 6, dashboards stay live continuously. The automation runs the calendar; you stop running the reports.
- Deliver where each audience already looks. Board members get a generated PDF pack, the CEO gets a dashboard link, collections gets the AR aging in email. Meeting people where they are is what makes automation stick.
- Set access controls on the reporting layer, not just on QuickBooks. Investors and lenders should see the pack you generate, not your entire ledger connection.
- Add a reconciliation check to every run. A scheduled comparison between pipeline totals and QuickBooks totals turns silent data drift into a visible alert.
Expected result: statements and dashboards arrive on schedule, and you find out if something breaks instead of discovering it in a board meeting.
The second workflow: cash flow forecasting whenever actuals update
Once actuals flow automatically, the same pipeline can maintain a 13-week cash flow forecast that updates every time QuickBooks data refreshes. Actual receipts flow in from the ledger; scheduled payables and payroll sit as known outflows; the projection rolls forward weekly. For owner-operators deciding whether to hire, buy equipment, or draw distribution, this single artifact usually justifies the whole project. The same pattern extends to budget-versus-actual variance views, which reuse the chart-of-accounts mapping you built in Step 2.
Troubleshooting
- The connection stops authenticating. QuickBooks Online connections require periodic reauthorization. Store the reconnect step in your runbook and assign an owner; a lapsed token on day 90 is routine, not a crisis.
- New accounts appear unmapped. Someone adds a chart-of-accounts line mid-year and it lands nowhere in the reporting layer. Fix: add a monthly check that flags accounts missing a mapping.
- Numbers do not tie to QuickBooks. Check the accounting basis (cash vs. accrual) and the date cutoffs first. Nine out of ten mismatches are one of those two.
- Class or location tracking is inconsistent. If departments tag transactions unevenly, departmental reports will mislead even when totals tie. Data quality comes before pipeline logic.
- Duplicates after a re-run. Sync jobs should write idempotently — re-running the same period replaces data rather than stacking it.
Where to take it next
A working pipeline is the foundation, not the finish. Layer on variance analysis, department-level views, or a connection into a BI tool, and revisit the KPI set once a quarter as the business changes. If you would rather have a senior team build and own this than assemble it yourself, Prizmstack scopes reporting pipelines as part of its broader data infrastructure work — you can start a project quote and get the workflow scoped against your actual books.
FAQ
Can QuickBooks schedule reports automatically in 2026?
Yes. QuickBooks Online can email standard reports such as the P&L and balance sheet on a recurring schedule. Scheduling ends there, though — anything that combines QuickBooks data with payroll, CRM, or budget data needs middleware or a custom pipeline.
How much does automated QuickBooks reporting cost?
Cost depends on the build path: middleware subscriptions are the cheapest route, while a custom pipeline is priced as a small data engineering project. Get the reporting spec written first, then scope it — spec-driven scoping is exactly how a partner like Prizmstack prices this work.
Is it safe to give a reporting tool access to QuickBooks?
Yes, when you use read-only API permissions, review the requested scopes, and restrict who can manage the connection. Automation typically reduces risk because it removes the manual spreadsheet copies that float around in email.
Will automation work with QuickBooks Desktop?
Desktop integration is possible but uses older tooling than the QuickBooks Online API. Most 2026 automation projects either run on QuickBooks Online or migrate to it first.
How often should automated financial reports refresh?
Statements tied to the monthly close should refresh once, right after close. Cash and receivables views benefit from daily or near-real-time refreshes. Match the cadence to the decision each report supports.
Do we still need an accountant if reporting is automated?
Yes. Automation removes copying, not judgment. Account review, adjustments, and interpretation stay human — they just start from reconciled data instead of from a spreadsheet export.
What is the first report worth automating?
The monthly P&L and balance sheet pack. It is the most repeated report in the business, and building it forces the chart-of-accounts cleanup every later report inherits.
One last thing
The teams that get the most from automated reporting are not the ones with the fanciest dashboards — they are the ones whose chart of accounts was clean enough that every number lands on one line. That cleanup is unglamorous, and it is the difference between an automation project that saves 3 hours a week and one that quietly produces the wrong numbers at scale.
Related guides
Topics covered
Written by Prizmstack Team
Full-spectrum software agency